making cartogram w/ ScapeToad
Owner & Collaborators
License

making cartogram w/ ScapeToad by oshimaryo is licensed under the Creative Commons - Attribution license.
Summary
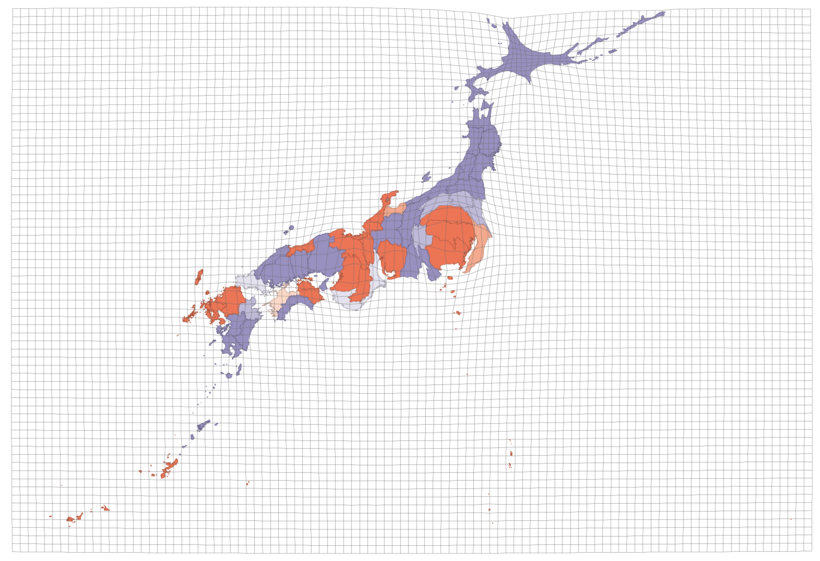
カルトグラム(統計地図、[英]cartogram)とは統計データに基づいて面積や距離を伸縮した地図のこと。ここではMacでの作り方を紹介します。たぶんWindows/Linuxでもある程度おなじ。
Materials
Tools
Blueprints
Making
- QGISのページのRequirementsに書いてある2つのソフトをウェアをダウンロード→インストール。
その後、QGISをインストールするんだけど本家のが見つからないので、nightly-buildをダウンロード→インストール。
より詳しくはGIS/QGISをMacにインストールを
- ScapeToadでは、Shapeファイルという形式のデータを使って、カルトグラムをつくります。ので、まずは地図としてつかうデータセットを探します。
- shp ファイルは地形図のパスに複数のkey-value型のデータを埋め込めるのが特長のようです。ここで埋め込んだデータをもとにCartgramを生成します。埋め込みデータを編集するにはQGISを使います。
- ScapeToadにデータ(.shpファイル)を読み込みます。
References
Usages
Project comments

Comments